Archive for 4. International Economics

Will ‘Abenomics’ Save the Japanese Economy?

Abenomics

アベノミクス: Abenomics in Japanese

PDF File: “Will ‘Abenomics’ Save the Japanese Economy?” by Kim Sang Keun

I. Introduction

Ever since Shinzo Abe came to power, the Japanese government led by LDP has vowed to revive the stagnant economy by implementing bold economic policies. In effort to overcome so-called ‘Lost Decades,’ which has deteriorated the ego of many Japanese people, Abe has announced three simple economic policies that earned the name ‘Abenomics’ after its proposer. This includes indefinite quantitative easing, flexible public finance policy and economic growth strategy.[8] In this paper, we will look at the economic logic behind the Abenomics and problems and risks associated with it.

II. Economic Logic Behind Abenomics

Through Abenomics, the Japanese government hopes to revive its economy by implementing bold, powerful economic policies that will pull its economy out of deflation, depreciate Japanese yen, and induce CPI inflation rate of 2% per year. The Japanese government saw the constant decline of overall price level by lack of aggregate demand as the main culprit of the long-term recession that its country was going through.[3] In order to ‘reflate’ its economy, Abenomics tries to implement quantitative easing, fiscal policy through expanding government spending, and provide economic growth strategy. We will first look at the quantitative easing and its economic theory behind what the Abenomics is trying to achieve.

For analyzing the economic theory of Abenomics, the Mundell-Fleming Model for a large open economy was used in this paper as the main model. The following are the IS-LM equations for the model:

IS: Y = C(Y-T) + I(r) + G + NX(e)

LM: M/P = L(r,Y)

Notice that the assumption of r = r* was dropped, which is an equation for a small economy that cannot influence the world interest rate. As Japan is the third largest economy in the world, the assumption that it has little influence on the world financial market had to be dropped. Therefore, the interest rate was treated as an endogenous variable. As a result, LM curve got a positive slope, instead of being vertical.

2

3

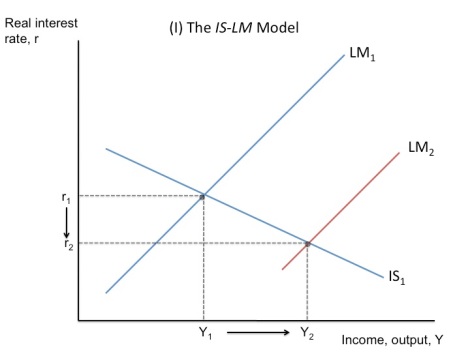
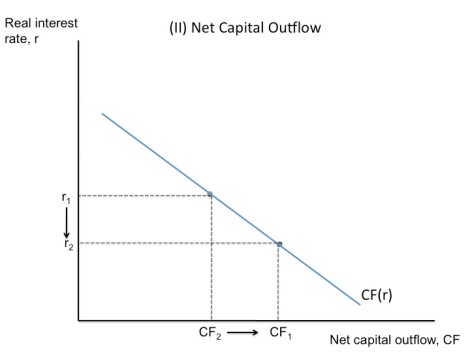
First of all, the Bank of Japan is targeting a 2% CPI inflation rate and increasing the money supply circulating in the economy by buying various financial assets such as the government bond, which is essentially monetary expansion policy.[3] It could be said that this indefinite quantitative easing is the core of Abenomics. On the graph above, the increase in the money supply shifts the LM curve to the right, raising the income from Y1 to Y2, and lowering the real interest rate from r1 to r2. The decrease in the real interest rate then increases the net capital outflow as is illustrated on the second graph.

4

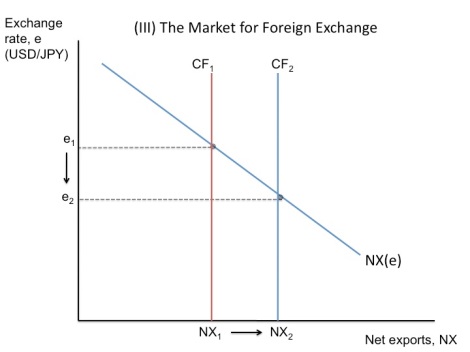
As the net capital outflow increases from CF1 to CF2, the supply of Japanese yen in the market for foreign exchange increases. The exchange rate falls from e1 to e2, depreciating the Japanese yen. This makes the Japanese goods relatively cheaper to foreign goods and the net export rises from NX1 to NX2. There are two channels for this mechanism. First, as the monetary expansion lowers the interest rate, this stimulates the investment. Second, as the monetary policy causes the currency to depreciate in the market for foreign exchange, this stimulates net exports.

5

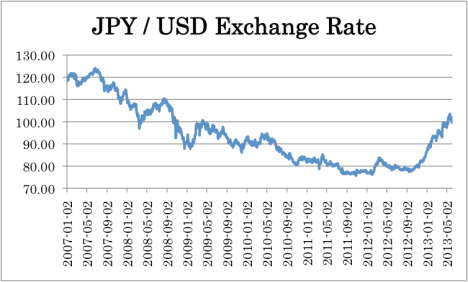
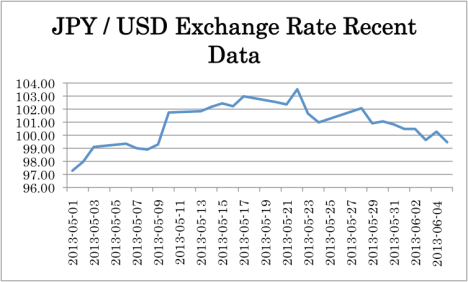
All in all, the Abenomics tries to devaluate its allegedly over-appreciated yen and cause an inflation rate of 2% as the output increases. As a result, the Japanese yen has depreciated until the 103.42 (JPY/USD) recently on May 22nd. This is the lowest in almost 6 years, ever since the Global Financial Crisis that hit the economy around the world in 2007. This is shown in the exchange rate graph above.

6

7

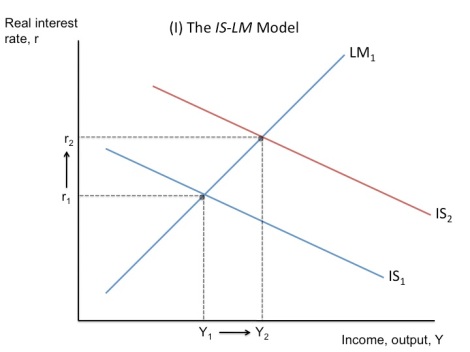
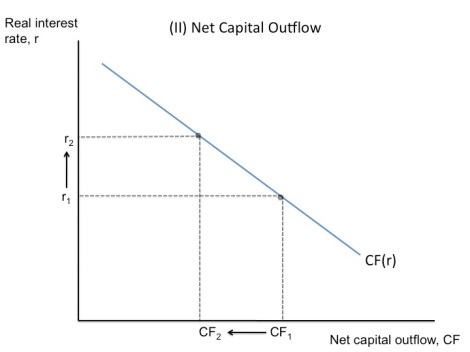
Secondly, the Japanese government is trying to initiate fiscal policy by expanding government expenditures. As the government implements fiscal expansionary policies the IS curve shifts to the right. As the graph above illustrates, this shift in the IS curve leads to an increase in the level of income from Y1 to Y2 and an increase in the interest rate from r1 to r2. The increase in the real interest rate reduces the net capital outflow from CF1 to CF2.

8

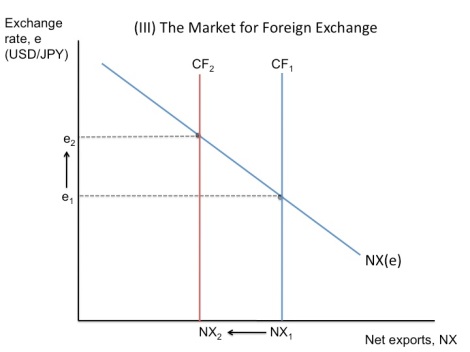
As the net capital flow falls, the supply of Japanese yen in the market for foreign exchange falls. This induces the exchange rate to appreciate from e1 to e2, which decreases the net export from NX1 to NX2 as the Japanese goods become more expensive relative to foreign goods.

As the graph illustrates, the fiscal expansion by Abenomics will raise the income and output for the Japanese economy. However, it is to be pointed out that although implementing both the fiscal and monetary expansionary policies will increase the output of the Japanese economy, the effect on the exchange rate is conflicting. Yet, this problem is accounted for as the Japanese government will set its ‘desirable’ exchange rate, possibly above 100 JPY/USD, and fix it so that other variables can freely adjust, although it might compromise some of the output to some degree. Or if the Japanese government considers the increase in the economic output, and therefore the inflation rate, more important over the exchange rate, it might decide to compromise fixating the exchange rate to their ‘desired’ level for the economic growth.

Thirdly, on June 5th, the Japanese government announced the third policy for Abenomics, which includes economic growth strategy. The government announced plans for bringing up the financial integrity of Japan, however, there were no significant policies that were announced.

III. Problems and Risks Associated with Abenomics

9

10

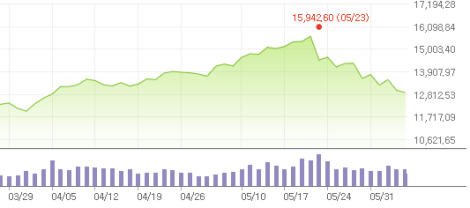
There is a rising skepticism towards whether Abenomics would really revitalize the Japanese economy as the exchange rate appreciated breaking the 100 JPY/USD boundary and as Nikkei Index crashed. Although, theoretically, Abenomics has a sound Keynesian background, many are pointing out the fact that it is too focused on the demand side of its economy, not on the supply side.

13

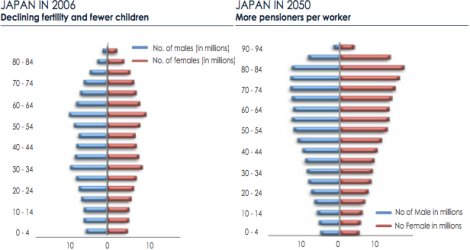
Japanese Demography Data[11]

One of the fundamental problems that Japan is facing is its ageing population. As the population pyramid gets inverted, the labor population is shrinking every year. This brings about number of problems for the Japanese economy. First, the government commitment in spending on pensions, medical expenses and social security will continually act as a substantial burden to the already indebted country with a public debt of 240% its GDP.[11] This will further worsen the financial integrity of the Japanese government leading to an erosion of international confidence in Japanese economy. The lack of confidence can raise the risk premium (CDS) shifting the IS* curve to the left and LM* curve to the right, as θ increases for r = r* + θ. But, the exchange rate would depreciate more than what is desired by the Japanese economy, and it would force the Bank of Japan to decrease the money supply in order to bring up the yen value, shifting the LM* curve back to the left. This would aggravate the situation and lower the total income in the Japanese economy. This then would induce the interest rates to depress the prices of financial assets, which will then reduce the collateral being used as bank loans. As a result, this will lead to financial problems for Japan, further exacerbating the problems. Secondly, its dwindling workforce cannot sustain the economic output level that is maintained in the future.[11] As it is shown on the data, the demography will drastically change so that more young people will have to support for the older population, which implies that this change in demography is the main culprit for the last two decades of deflation and stagnant economic growth.[11] This has another implication to why the consumer demand might be falling behind.

In this sense, it could be said that Abenomics is failing to address the core problem of its economy. It must ask why consumer demand is inherently weak. Another major reason why the Japanese economy is stagnating is the poor productivity. This may sound strange to many people as Japan was once praised as technologically advanced country. However, according to the statistic, Japanese productivity lags badly behind world’s leading countries in many areas. For example, it lags 30% behind the U.S. in manufacturing with automobiles industry in exception.[9] Therefore, corporate reforms are needed in order to let inefficient firms downsize or die and be replaced to better ones.[9] In the case of Korea, as it suffered trough the so-called IMF Crisis in 1997, it underwent painstaking corporate reforms to let the inefficient firms die and raise the overall competitiveness of its economy. So it is doing relatively fine in terms of corporate competitiveness and financial integrity compared to Japan, although this is shaking a little due to Abenomics.

What is problematic right now is that the third policy for Abenomics lacks fundamental and specific content, which started to give erode out public confidence in Abenomics. As it was mentioned, this resulted in the crash of Nikkei Index and the re-appreciation of Japanese yen, breaking the 100 JPY/USD boundary. Shinzo Abe, afraid of losing the votes, has put aside the painstaking reforms to later, such as corporate tax cuts that will improve the productivity of Japanese firms. There was a discussion within the Japanese government in cutting the corporate taxes from 30% to 20% and to implement new policies that will make the labor market flexible.[5] However, flexible labor policy means temporary job losses[11], and it seems that Shinzo Abe is putting these essential reforms after the Japanese upper house elections. This could erode out confidence in Abenomics losing its force towards reviving the economy.

There is another risk associated with Abenomics. As the yen depreciates, net export increases as domestic products gets cheaper abroad, however, imports get more expensive. This is a big problem for Japan as ever since the Fukushima nuclear disaster, the word ‘energy crisis’ was lingering around the Japanese newspapers for two years. As Japanese public refused to use nuclear power, the Japanese government had to turn to more expensive imported energy, such as LPG, oil and naphtha, increasing the monthly value of Japanese energy imports from 1.4 trillion yen to 2.2 trillion yen.[12] This could deteriorate the competitiveness of Japanese companies, as energy prices go up. In addition, export accounts for only about 14% of its economy.[1] So the core of Abenomics should be in order to revive the domestic economy, not through export. The increase in energy prices could raise the domestic consumer prices without actually improving the income of the Japanese firms and consumers. Therefore, there is a risk towards Abenomics in that expensive energy imports will drag the Japanese economy into another lost decade.

IV. Conclusion

In conclusion, Abenomics is a sound Keynesian policy that could save the Japanese economy from deflation. The Mundell-Fleming Model was used to illustrate the economic theory behind Abenomics. However, there were considerable risks associated with Abenomics, such as the ageing population, poor productivity and the energy crisis. The key to success for Abenomics would be dependent on whether the Japanese government effectively manages these risks and confronts the fundamental reforms that would improve the supply side of its economy.

Reference

1. 박영철, 아베노믹스 실패 가능성 높다, <주간조선>, 2013.03.18, http://weekly.chosun.com/client/news/viw.asp?nNewsNumb=002248100014&ctcd=C05

2. 박형준, 日 환율-주가-금리 3각 부메랑… 아베노믹스 두달만에 휘청, <동아일보>, 2013.06.05, http://news.donga.com/3/all/20130605/55643597/1

3. 이형근, 아베노믹스, 디플레이션 탈출과 엔고 시정 추진, 2013년, 평화문제연구소, 통일한국 제352호, pg34-35, http://www.dbpia.co.kr/Article/3129836

4. 정성춘, 이형근, 서영경, 일본 아베노믹스의 추진 현황과 정책 시사점, 2013년, 대외경제정책연구원, 오늘의 세계경제, Vol. 13, No. 5

5. 차학봉, 아베노믹스 세 번째 화살 ‘不發’, <조선일보>, 2013.06.06, http://news.chosun.com/site/data/html_dir/2013/06/06/2013060600263.html

6. 한영기, 아베노믹스의 효과 및 과제, 2013년, 한국은행 동경사무소

7. 한창만, 아베노믹스 ‘거꾸로 효과’, <한국일보>, 2013.02.20, http://news.hankooki.com/ArticleView/ArticleView.php?url=world/201302/h2013022021083122510.htm&ver=v002

8. Adams, W. J. (2013). Japan: Assessing the Future of Abenomics, The Boston Company, http://www.thebostoncompany.com/assets/pdf/views-insights/April13_Views_Insights_Future_of_Abenomics.pdf

9. Katz, R. (2013). Abenomics Is Bad Medicine, The Wall Street Journal, http://online.wsj.com/article/SB10001424127887324590904578287472450294546.html

10. Mankiw, N. G. (2013). Macroeconomics Eighth Edition, Macmillian

11. McNerney, G. J. (2013). Will ‘Abenomics’ Ensure Japan’s Revival?, Thomas White International, http://www.thomaswhite.com/pdf/Will-Abenomics-Ensure-Japans-Revival.pdf

12. Schaede, U. (2013). Abenomics cannot succeed without cheap nuclear power, The Japan Times, http://www.japantimes.co.jp/opinion/2013/06/05/commentary/abenomics-cannot-succeed-without-cheap-nuclear-power/#.UbFlP-uPJBy

Data

13. St. Louis Economic Research: http://research.stlouisfed.org/fred2/graph/?id=DEXJPUS

14. Naver금융: http://info.finance.naver.com/marketindex/worldExchangeDetail.nhn?marketindexCd=FX_USDJPY

15. Naver금융: http://finance.naver.com/world/sise.nhn?symbol=NII@NI225#

Leave a comment »

Is Abenomics Coming to a Halt?

Abenomics

Abe Shinzo, the Japanese Prime Minister, advocates yen devaluation

Wall Street Journal: Abenomics Will Be Felt Beyond Yen

Hankook Ilbo(Korean): 아베노믹스 ‘거꾸로 효과'(Abenomics ‘Reverse Effect’)

Abe Shinzo had explicitly announced that he would artificially devalue yen in the hope that this will help its export-dependent economy. His idea was that devaluation of yen against other currencies, especially USD, would improve price competitiveness of Japanese products overseas. This announcement was quickly criticized by many nations dependent on export such as Korea and Germany.

The Japanese government said that it would pump ‘infinite’ amount of money supply in the economy until it reaches its target inflation rate of 2%, thus achieving the devaluation of yen. Wall Street Journal expected that the inflation rate would make it less attractive for Japanese households to save and invest their money else where or simply use them to go on shopping. “Deutsche Bank said in a note Wednesday, spurring a “meaningful reallocation” of these deposits into offshore assets.” Therefore, Abe’s policy should have helped to vitalize the consumer sector of Japanese economy and at the same time increase its export to foreign countries.

However, Hankook Ilbo, a Korean newspaper, has published an article that Abe’s devaluation of yen is actually having a reverse effect on Japanese economy. According to the report published by Japanese Ministry of Finance in February 20th, 2013, exports decreased 9.4% compared to the previous month, while imports increased 8.2%. This resulted in 1.63 trillion yen deficit.

The newspaper analyzed that the main reason for this deficit is the rising prices for the energy imports due to the yen devaluation. The nation has been importing more of energy supplies such as LNG, oil, and naphtha, as it tried to diversify energy usage and reduce nuclear power following the Fukushima Nuclear Accident. According to Hankook Ilbo, “If Japanese firms fail to significantly recover from this deficit, Abenomics will be hit hard.”

In addition, many Japanese firms are showing their reluctance in raising wages for workers, which is very important for Abenomics to work in order to revive the real economy. They believe that devaluation alone will not simply rejuvenate the economy. Many Japanese companies have been outsourcing their factories overseas and it would be very hard to retrieve all those back to Japan in very short period.

Of course, it has only been several months, so it will be hard to tell whether Abe’s yen devaluation is doing well for the Japanese economy. But, I think that, from reading these articles, it would be better off for a Japanese economy to appreciate yen due to significant the increase in the energy import. The devaluation certainly is doing no good for Japanese economy and disturbing other export-driven economies such as Korea, Germany and etc.

Leave a comment »

Patent Lawsuit: Apple, Samsung and the Prisoner’s Dilemma

Apple vs. Samsung in a Patent War

CNET News 1: “Apple vs. Samsung: 50 suits, 10 countries – and counting”

CNET News 2: “Samsung, Apple CEOs meet without coming to agreement?”

Meritz Investment Bank (Korean): PDF File

A hostile patent litigation between Apple and Samsung started ever since Apple accused Samsung of copying its designs for smartphones and tablet PCs. In response, Samsung dodged back with patent lawsuits concerning the mobile technology. According to CNET News, this litigation chaos augmented into 50 lawsuits against each other in 10 different countries. Apple became wary of Samsung’s ever-increasing market share of the smartphones and tablet PCs.

A smartphone or a tablet PC market can be said to be an oligopoly. There is only a handful of firms offering the product: Apple, Samsung, HTC, Sony, and so on. It is definitely different from a PC components market where there are lots of firms providing the identical product.

As Samsung’s market power is increasing in both the smartphone and the tablet PC market, Apple has opened a Pandora’s Box by filing a lawsuit against Samsung, as it was mentioned above. This has triggered the problem of Prisoner’s Dilemma, of which the ‘players’ in a ‘game’ are forced to choose the option that makes both of them worse off. In this case, the ‘players’ are Apple and Samsung, and the ‘game’ they are playing is the chicken game of patent litigations.

Table based on Game Theory: Prisoner’s Dilemma

This table illustrates the situation that Apple and Samsung is facing. According to the table, whatever the opponent chooses to do, the best option for a player is to file a lawsuit against the opponent. For example, for Samsung, it is the best option for it to file a lawsuit against Apple because the best-case scenario is that it will possibly kick Apple out of the market. The worst-case scenario is that both Samsung and Apple will possibly be kicked out of the market. However, this case is better than Samsung being kicked out of the market while Apple stays in the market with the market gain, in the point of view of Samsung. The reason behind choosing to file a lawsuit is the same for Apple.

As a result, they reach a Nash equilibrium, in which both of them file a lawsuit against each other, making them worse off. The patent lawsuit can be seen as a deadweight loss that is ‘wasted’ in a litigious process. Some people argue that the only people gaining from this situation are the lawyers. Consumers are the ultimate victims of this patent war because the ligation burdens are passed through higher prices for the products Apple and Samsung produce.

However, it should be noted that this ‘game’ of patent lawsuits is repeated numerously, 50 lawsuits as it was mentioned. Meritz Investment Bank’s analyst Lee Secheol anticipated in April that Apple and Samsung would stop and reconcile with each other as the ‘game’ is repeated. He anticipated that both firms would realize that this situation is making them worse off and that they would sit down at the negotiating table.

According to CNET News, CEOs of Apple and Samsung did have a meeting. However, they have never came up with an agreement. The fact that they had a meeting to reconcile showed that both of them realized they were in a situation of prisoner’s dilemma. However, their disagreement over withdrawing from a patent war also showed that this issue has become somewhat emotional, which makes it beyond the problem of prisoner’s dilemma.

Consumers should realize that this is not only doing harm to both the companies but also doing harm to themselves. This patent war will inevitably lead to an increase in the prices of products that Apple and Samsung produce and will significantly limit the number of choices that consumers can make if one of them are kicked out of the market as a result of a lawsuit. Also, the products they purchase may be limited in functions or features due to the patent constraints.

Leave a comment »

Exam Review Blog Posts: Exchange Rates

Questions:

(a) Explain three factors which may cause changes to occur in a country’s exchange rate under a floating exchange rate system.

(b) Evaluate the likely impact on a country’s economic performance of a substantial depreciation of its exchange rate.

1. The question (a) is asking for three factors that affects the floating exchange rate system. Also, the question (b) is asking the test taker to evaluate on the effect due to the depreciation of the exchange rate.

2. Floating Exchange Rate: Where the exchange rate is floating (as are all major currencies in the world), it will be determined by market forces – that is supply and demand. As in any other market, the rate will change constantly to reflect how much of the currency is being traded. However, what determines the supply and demand for the currency? Let’s take the Baht (the Thai currency) as an example and look at the factors that affect supply and demand and therefore the equilibrium exchange rate. (Triple A)

3. Governments can use exchange rates to affect economic performance. A rising exchange rate, which is often linked to an increase in base interest rates, leads to exports becoming more expensive but imports falling in price. This would reduce part of the inflationary pressure within an economy. A fall in the exchange rate would lead to the reverse and might help domestic businesses export more. (Triple A)

4.

  • Floating Exchange Rate: the exchange rate system is affected by the supply and demand of the currency exchange market.
  • Depreciation of the Exchange Rate: this usually occurs when either the supply of the currency increases or the demand of the currency decreases.

5.

This is the diagram for the depreciation of the currency as a result of the increase in the supply of the currency from S1 to S2. The quantity of the currency increases from Q1 to Q2, however, the value of the currency in terms of another currency goes down. This is why the currency depreciates when the supply of the currency increases.

The currency can depreciate also when the demand for the currency decreases from D2 to D1. The quantity of the currency demanded decreases from Q2 to Q1 and the value of the currency decreases from $0.35 to $0.25. This is why the currency depreciates when the demand for the currency decreases.

As the currency depreciates, the exports will increase and the imports will decrease. This will balance of payment and decrease the current account. The country will be in the trade surplus, however.

Comments (2) »

Diagrams: AD/AS + Section 4

The increase in the aggregate demand from AD1 to AD2 increases both price level and real output from P1 to P2 and from Q1 to Q2 respectively.

Aggregate demand could be increased by many factors. First of all, reduction in taxation could increase the consumption. Secondly, the reduction in interest rates will most likely shun away consumers to save their money but spend them. Also, due to the low interest rate, there will be less burden to borrow money. Therefore, this would both increase the consumption and the corporate investment. Thirdly, increase in government spending would increase the aggregate demand because it is one of the factors that comprises of the aggregate demand. The governmental spending boosts up the consumption in products and increases the earning/income in the sector. Finally, the improved competitiveness could also increase the aggregate demand as the opportunity cost in production would decrease. In addition, the increase in the competitiveness could also boost up the export, which also increases the aggregate demand.

The decrease in the aggregate demand from AD1 to AD2 decreases both price level and real output from P1 to P2 and from Q1 to Q2 respectively.

Decrease in aggregate demand is caused by many factors. First of all, the increase in the taxation could decrease the consumption. Secondly, the increase in the interest rate could allure consumers not to spend money but to save them. In addition, the high interest rate would attract lots of money in to the bank, draining the money out of the market. Also, the high interest rate decreases the corporate investment. Thirdly, decrease in the governmental spending would also decrease the aggregate demand. Finally, decrease in the competitiveness could also decrease the aggregate demand by increasing the opportunity cost associated with the production. In addition, loss in competitiveness could also lead to decrease in export, which also decreases the aggregate demand.

Increase in the aggregate supply from AS1 to AS2 increases real output from Q1 to Q2 but decrease the price level from P1 to P2. This is desirable as the price level is decrease and the real output has increased.

Increase in the aggregate supply could be caused by many factors. First of all, reduction in indirect taxation could lead to increase in the aggregate supply. As the taxation is reduced from the price of the product, the producer could manufacture products at much lower opportunity cost and gain price advantage. Secondly, the reduction in wages of the employees would lead to cut in the production cost and therefore gain price competitiveness. This way, the manufacturer could sell more products at much cheaper price, increasing the aggregate supply. Thirdly, the reduction in price of raw material also leads to the increase in the aggregate supply due to the cut in the production cost. Finally, favorable weather conditions could help industries that depend on the weather to produce more. Therefore, this would also increase the aggregate supply.

The decrease in aggregate supply from AS1 to AS2 decreases real output from Q1 to Q2 but increases the price level from P1 to P2. This is the worst scenario as the price level increase and the real output decreases.

There are many factors affecting the decrease in the aggregate supply. First of all, the increase in the indirect taxation could lead to increase in the cost of production. Therefore, the producer would only be able to produce less products than he/she used to produce. Secondly, the increase in the wages could also lead to the increase in the opportunity cost and the production cost. This would also increase the aggregate supply. Thirdly, the increase in the price of raw materials also increase the production cost that aggravates the decrease in aggregate supply. Finally, adverse weather conditions could ruin the production of industries that depend on the weather. So, this would also worsen the decrease in the aggregate supply.

Japan and China are in a comparative advantage to each other. Japan produces more automobiles at QA2 than what China’s producing at QA1. However, China produces more break pads at QB2 than what Japan is producing at QB1. In conclusion, Japan has a comparative advantage in automobiles over China, however, China has a comparative advantage in break pad over Japan. In these countries were to initiate FTA, they would both have loss and gains.

In this diagram, India is at absolute advantage over Fiji Island. India produces clothes at QC2 which is way more than what Fiji Island is producing at QC1. Also, India produces more hats at QH2 that is more than what Fiji Island is producing at QH1. In conclusion, as India produces more products in both items, India is in an absolute advantage over Fiji Island.

This economy is in a free trade with the world without any trade barriers. The price dropped from Peq to Pworld.  Also, the quantity demand increased from Qe to Q2. This means that only consumers until Qe were able to buy a product, but now consumers until Q2 are able to buy the product they could buy before. From Q1 to Q2, it indicates the amount of imported goods and services. However, the domestic production decreases from Qe to Q1 to the price-competitive world providers. In conclusion, the consumers benefit the most from this situation.

In this economy, it imposes tariffs on imported goods. The tariff increases the price from Sworld to Stariff. This decreases the quantity demand for the product from Q2 to Q4. This means that consumers from Q4 to Q2 no cannot buy the product because of the increased price. Also, the deadweight loss occurs due to inefficient domestic producers entering the market. The amount of imported goods decreased from (Q2-Q1) to (Q4-Q3). This is a great loss for the world providers because they are losing the market share both ways from left and the right whereas the domestic providers are only gaining by one side from the left. The government also gains revenue from the tariff imposed on the imported goods.

In this economy, quota is imposed on the economy. The quota increase the price from Sworld to Stariff. This decreases the quantity demanded from Q2 to Q4. This decreases the imported good to the market from (Q2-Q1) to (Q4-Q3). Also, the foreign producers that avoided the quota benefits greatly by the windfall gain. However, there will be a deadweight loss caused by the inefficient producers. In addition, the government will gain nothing from this situation because they are not imposing a tariff.

In this diagram, the government is subsidizing the domestic industries to fight off the competitive foreign providers. The subsidy shifts the supply curve for the domestic providers from Sdomestic to Sdomestic+subsidy. This allows the domestic providers from Q1 to Q3 to re-enter the market. In the other hand, the imports decrease greatly by (Q3-Q1), which was taken from the domestic providers that are subsidized. The consumers are not hurt in this situation because there is no decrease in the quantity demanded, which means there was no increase in number of consumers who are not able to buy the product. Also, unlike the tariff and quota situation the importers do not lose by 2 ways but by only 1 way (from the left).

The fixed exchange rate could cause shortage of the quantity of the currency. As the demand for the imported goods increase, people would need more of the currency to buy another currency. This is why the supply curve should move from S1 to S2. However, due to the fixed exchange rate, the shortage in supply of the currency occurs.

Fixed exchange rate could cause the surplus in the supply of the currency in the market. As the demand for the exports increase overseas, the foreigners would demand more of the currency to buy the exports. This is why the demand curve should move from D1 to D2. However, due to the fixation in exchange rate, the surplus of currency occurs.

Floating exchange rate well suits the demand and the supply of the currency. Also, it does not have the problems of surplus/shortage of currency that fixed exchange rate systems have. The currency is demanded at the quantity of Q and the value of the currency in terms of another currency is at P.

Demand for the currency could be increased from the increased demand of exports. If foreigners are attracted to the exports, they would demand more of the currency to buy the exports. Therefore, this would increase the demand for the currency from Q1 to Q2 increasing the value of the currency in terms of another currency from P1 to P2. This is called appreciation of the currency as the value of the currency increased.

Demand for the currency could decrease by the lack of interest in exports. The foreigners would not demand less of the currency, decreasing the demand curve from D1 to D2. This decreases the quantity demanded for the currency from Q1 to Q2 and decrease the value of the currency in terms of another currency from P1 to P2. This is called the depreciation of the currency as the value of the currency has been decreased.

The increase in the supply of the currency could be caused by the increased interest in the imports. The consumers would need more of their currency to buy another currency to buy imports. This would increase the supply curve for the currency from S1 to S2. This increases the quantity demanded for the currency, however, it depreciates the currency from P1 to P2.

The decrease in the supply of the currency could be caused by the decrease in the interest for the imported goods. As consumers would demand less of their currency, the supply curve would shift from S1 to S2 decreasing the quantity demand for the currency but increase the value of the currency in terms of another currency. This causes the currency to appreciate.

Comments (1) »

List of Definitions for Section 4

This is the list of economic definitions used in Section 4 (International Economics) with real world examples to have better understanding of the definitions. It would be faster if you use command-F (Mac) or control-F (PC) to find the definitions.

1. Trade – is an exchange involving goods, services, or currency.

2. Reasons for Trade – There are several reasons for why countries trade with each other.

  1. Different Factor Endowments – There are some economies that are rich in natural resources while others have comparatively little resources. Trade enables economies to specialize in the exports in resources and money to buy imports of other goods that they need but lack.
  2. Increased Welfare – specialization and trade allow countries to gain a higher level of consumption than they would do domestically and this leads to increased welfare and higher living standards.
  3. To gain Economies of Scale – with specialization and production on a larger scale than may be possible domestically, a country may be able to gain more economies of scale. This will lead to lower average costs and benefit consumers through lower prices.
  4. Diversity of Choice – trade enables people to access and approach diverse and variety of goods and services that may not be available only in the domestic market.
    • Real World Example: Korean consumers are able to buy Apple products from US and have wide variety of choice along their own electronics manufacturers Samsung and LG.
  5. Increased Competition – Increased competition helps domestic industries to have improvements in productivity and efficiency. In addition, it gives domestic firms better incentive and improve their products to compete against foreign firms.
    • Real World Example: As Apple introduced the iPhone, Korean phone manufacturers such as Samsung and LG began to make their own smart phones to counter the increasing Apple influence on Korean domestic market. Warc: iPhone threatens LG and Samsung in Korea
  6. Engine for Growth – increased trade helps domestic economies to grow and make improvements in living standards of the people.

3. Free trade – It is international trade free from any restrictions like tariffs, quotas or other protection.

  • Real World Example: Korea and EU signed the agreement to initiate FTA that will eliminate all the trade barriers imposed on the trade. ICTSD: EU-Korea FTA

4. Protectionism – it is a policy to protect domestic industries from fierce foreign competitions. It includes tariffs, quotas, embargo, and voluntary export restraints.

  • Real World Example: Japan has a heavy protectionism on their domestic rice industry. Japan imposes 341 yen per kilogram tariff on all imported rice. This raises the price of the imported rice to be way higher than the quota, effectively prohibiting the imported rice from hurting domestic rice industry. In addition, Japan subsidizes the rice industry and the taxpayers paid $2.8 billion in 1999 alone. Japan-101: Japanese Rice Trade Policy

5. Tariff – it is a tax on imports in order to protect domestic industries by increasing the price of the imports. This gives domestic industries equivalent comparative advantage to the foreign industries.

  • Real World Example: Japan imposes a tariff of 341 yen per kilogram on imported rice.

6. Quotas -it restricts the maximum amount of imports allowed into an economy. This reduces the amount of imports into the economy and increases the equilibrium price within the market.

7. Exchange Control – it limits the amount of foreign currency available for paying for imports. This reduces the amount of imports in the economy to protect domestic industries.

  • Real World Example: China has exchange control to regulate not only the value of their currency but also to regulate the amount of imported goods to be in Chinese domestic market. CABC: Chinese foreign exchange control system

8. Export Subsidies – it is a subsidy offered to domestic industries to allow exporters to export more products than the natural equilibrium point would allow. The benefits the foreign consumers with increased economic welfare and the decrease in the price of the imports. Tax payers would have to bear the burden, however, the domestic industries would enjoy more wages and job security. However, this could reduce the domestic exporters’ interest in domestic market and disregard the market. This could lead to an increase in domestic prices.

9. Voluntary Export Restraints (VER’s) – it is the voluntary quota set by the manufacturer.

10. Administrative Obstacles – governments could set trade barriers such as long, slow paperwork. This makes it hard for foreign firms to to compete with the domestic firms.

11. Health and Safety Standards – high health and safety standards for imported goods can make it difficult for foreign firms to compete in domestic market. This protects the domestic industries.

  • Real World Example: Japan only allows US beef that are aged below 20 months in fear of mad cow disease. Japan considers beef aged over 20 months as ‘highly dangerous’ of mad cow disease and prohibits them from the domestic beef market. Bloomberg: Japan-US Beef, Mad Cow Disease Concerns

12. Environmental Standards – high environmental standards also makes the foreign firms to compete in the domestic market. This protects the domestic industries.

13. Downward Multiplier Effects – protectionism could reduce the level could affect the country’s exports to be less competitiveness and decrease the exports due to decreased amount and the increased price of imports.

  • Real World Example: Korea has tariffs on imported chicken and this may have been the cause to the high price of domestic chicken in Korean market. The high price in chicken reduces the competitiveness of industries that rely on chicken as part of their production. For example, KFC’s would have great decrease in the competitiveness in the price of their chicken due to the high price caused by the protectionism.

14. Globalization -it is the integration of national economies into international economy trough trade, commerce, investments, and capital flows.

  • Real World Example: China is a communist country, but it has realized that it could benefit from the globalization and trade. So, China opened up its market and economy to the world and became an enormous part of the global economy.

15. Types of Trading Blocs

  1. Free Trade Area (FTA) – it is an area where there are no trade barriers. Sovereign countries must not implement trade barriers on the member countries of FTA.
  2. Customs Union – it is similar to FTA in that it is free from trade barriers. However, it is different in that countries are no longer fully sovereign over the trade policies. There is standardized trade policies that the countries must abide by to.
  3. Common Market -it allows free movement of factors of production such as labor and capital between the member countries without restriction.
  4. Economic Union – it is a developed trading bloc in the level of integration. The member states may have common economic policies, common currency, and common monetary policies.
    • Real World Example: EU is an economic and political union that has common economic policies and common currency as Euro.

16. World Trade Organisation (WTO) – it is an organization that intends to supervise and liberalize international trade. It penalizes countries implementing illegal trade barriers on the other country.

17. Balance of Payments – it measures the international trade performance of an economy and shows how well it is managing to match imports and exports of goods and services and the flows of investment in and out of the country.

18. Current Account – it records imports and exports of goods and services.

19. Capital Account – it records the flow of money into and out of a country for investment and other purposes.

20. Exchange Rate – it is the price of one currency expressed in terms of another.

  1. Fixed– the exchange rate of one currency is fixed in value to other currencies.
    • Real World Example: North Korea has a fixed exchange rate. However, the fixed exchange rate does not accurately reflect the market value of the currency as the market value for the currency is often 20 times lower than the fixed value for the currency.
  2. Floating – the exchange rate of one currency is completely dependent on the market mechanism of supply and demand of the currency.
    • Real World Example: Japan has a floating exchange rate. The government does not intervene with the exchange rate.
  3. Managed or Dirty Float – the exchange rate that is based on floating exchange rate, however, has maximum and minimum limits managed by the government.
    • Real World Example: China is implementing dirty float system for the exchange rate. It sets the maximum value to the exchange rate in order to artificially depreciate its currency and therefore export more to the world.

21. Dumping – It is to sell a product in another country at a price below its unit cost of production in order to decimate the domestic industry of that country.

  • Real World Example: Philippines once had a competitive agricultural industry. It was once famous for its efficiency to harvest crops 3 times a year whereas other agricultural industries could only harvest 1 time. However, as it opened up its market to the world, foreign agricultural industries started dumping their crops in Philippines domestic market. The domestic agricultural industries soon collapsed, and the foreign agricultural industries raised the price of the crops. Philippines’ economy significantly shrank and gave its title of Asia’s 2nd developed nation to other countries like South Korea, Taiwan, Hong Kong, etc.

22. Anti-Dumping – It is a legislation to protect an economy against imported goods that are sold at a price below its unit cost of production.

  • Real World Example: World Trade Organization (WTO) monitors firms dumping maliciously on foreign markets and penalize them as soon as they spot them on the action.

Resources:

  • Triple A Learning
  • Economics Glossary
  • Wikipedia

Leave a comment »

Spanish Currency in Jeopardy (via Bobby’s Blog)

I thought that this blog post had an insightful analysis on the Spanish currency exchange rate and how the exchange rate is affecting the current account of the Spanish economy. According to the blog post, Spanish are experiencing double-digit deficit in their current account. In addition, the author analyzes the Spanish dilemma over whether they should stay or defect from Euro.

Spanish Currency in Jeopardy At this time, Spain, as part of the PIGS, countries that have double digit deficits in terms of current account in GDP, is suffering greatly. According to the article by Paul Krugman, the only solution Spain has formulated in order to recover from the deficit is to abandon the euro currency. By doing so, they will be free from Germany, a country that is doing relatively well in light of the current recession. Unlike Spain, it is currently experie … Read More

via Bobby’s Blog

Leave a comment »

U.S. vs. China: Currency and Trade Dispute

Historically, China used the fixed exchange rate for their currency Yuan over almost 50 years. Of course, China has discontinued its inflexible practice from the start of July of 2005. Instead of the fixed exchange rate, they employed a flexible exchange rate system. However, it wasn’t 100% flexible or floating because of the Chinese government’s intervention in the currency exchange market. What the government would do is that they would use their reserves of currencies to ‘manipulate’ or manage the currency exchange rate to be at a certain level. Exchange rate is a ratio between the value of two currencies and it is a method to translate the value of one currency into another.

China armed with undervalued currency and its huge industrial factories and infrastructures, it gains enormous amount of surplus in current account against United States. The surplus in current account means that the country is exporting more than it is importing. Therefore, China is gaining lots of US dollars from the trade. If you look this at the American point of view, US is losing in terms of current account against China. US is importing more than it is exporting. The imbalance in the current account in both cases (surplus and deficit) could create some problems. For deficit in current account, the country will experience in large amounts of payments losing to the foreign country. So US will be losing lots of its payments and interests to China. For surplus in current account, it is considered ‘desirable’ compared to the deficit in current account, however, it could mean that the country is not experiencing the highest possible standards of living. Also, it could be seen as economy’s under-performing. Also, it exerts pressure on the exchange rate to appreciate the currency of the country.

As you could see, the fixed exchange rate could cause a problem of shortage in the currency supply. This would generally push the exchange rate upwards, but the fixed rate block this. Therefore, the shortage in the supply of the currency occurs.

What would have happen if the Yuan got stronger and appreciated? It would decrease the exports of China dramatically. Conversely, it would increase the imported goods to China. This will ‘fix’ the imbalance and lower the surplus in current account against United States. In the point of view of Americans, this will increase their exports to China and decrease the imports due to increase in the price. This would be beneficial for both countries’ balance of payment, however, China refuses to appreciate their currency. It is because the weak Yuan stimulates exports to US and this is the key engine for China’s enormous economic growth. They think that the surplus in the current account is a good thing, however, as it was mentioned there are problems with it also.

In conclusion, China’s currency policy is creating an imbalance in the trade between United States and China. Also, it is creating the imbalance in the balance of payment. It would be idealistic if China gave up their under-evaluation policy. However, it will increase the unemployment rate in China as the exports decrease and the number of workplaces in China decreases. Conversely, this will be beneficial for United States for it will lower the unemployment rate by the increase in exports and increase in the number of workplaces.

Resources:

Council of Foreign Relations – Confronting the China-US Economic Imbalance

Wikipedia – Fixed Exchange Rate

Graph from Triple AAA Reading – Fixed Exchange Rate

Comments (1) »